


The Gold Beneath the Data: Secrets of Data Mining
Data mining is the process of discovering patterns, anomalies, and correlations within large datasets using analytical techniques to transform raw data into useful knowledge. This knowledge is then used to make predictions, solve problems, and improve business decisions and outcomes across various sectors like marketing, finance, and fraud detection.
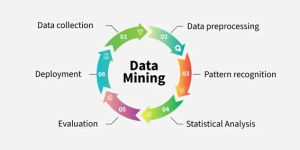
Data mining typically involves several stages:
- Data Preprocessing: Cleaning and preparing the raw data for analysis.
- Data Transformation: Converting the data into a suitable format for mining.
- Pattern Discovery: Using algorithms to find interesting patterns, trends, and associations within the data.
- Pattern Evaluation: Assessing the validity and significance of the discovered patterns to extract useful knowledge.
- Knowledge Representation: Presenting the findings in a way that can be easily understood and utilized.
Key Techniques
Data mining employs various techniques, including:
- Classification: Categorizing data into predefined classes.
- Clustering: Grouping similar data points together.
- Regression: Predicting continuous values.
- Association Rule Mining: Identifying relationships between data elements, often seen in market basket analysis (e.g., customers who buy bread also buy butter).
- Anomaly Detection: Finding unusual patterns that deviate from normal behavior, useful for fraud detection and security.
Applications of Data Mining
Data mining is used in many areas:
- Business: To improve marketing strategies, predict customer churn, and understand consumer behaviour.
- Fraud Detection: To identify suspicious transactions in finance and insurance.
- Supply Chain Management: To optimize processes, manage inventory, and forecast demand.
- Network Security: To detect intrusions and unusual network traffic.
- Market Analysis: To predict market trends and identify investment opportunities.
Data mining application examples
Here are some real-world examples of data mining:
- Market basket analysis. Retailers use data mining to analyze large data sets and discover consumers’ buying patterns, such as items that are frequently bought together or seasonal trends. They can use this information to better organize their physical stores or websites, predict sales, and promote deals
- Academic research. In the field of literary studies, data mining techniques can be used to analyze texts and understand the emotions expressed by authors or characters. Sentiment analysis (or opinion mining) involves using natural language processing and machine learning algorithms to determine the emotional tone of a text.
- Education. Educational data mining (EDM) aims to improve learning by analyzing a variety of educational data, such as students’ interactions with online learning environments or administrative data from schools and universities. This method can help education providers understand what students need and support them better (e.g., through customized lessons or by identifying and engaging with at-risk students before they drop out).
What are different data mining techniques?
Data mining techniques draw from various fields like machine learning (ML) and statistics. Here are a few common data mining techniques:
- Classification is the task of assigning new data to known or predefined categories. For example, sorting a data set consisting of emails as “spam” or “not spam.”
- Clustering is the process of grouping data that share common characteristics into subgroups or clusters. Unlike classification (where groups are predefined), clustering is a discovery technique that helps us identify patterns. This allows businesses to create customer segments based on loyalty, communication preferences, or any other trait that emerges from the data.
- Association rule learning is a technique that looks for relationships between data points. A grocery store chain may use association rule learning to find out which products are frequently bought together and use these insights for promotions.
- Regression is a statistical method used to model the relationship between a dependent variable and one or more independent variables. The goal is to predict the value of the dependent variable based on the values of the independent variables. For example, using historical data about houses with similar characteristics, we might predict the future value of a house.
- Anomaly or outlier detection is the process of identifying unusual data within a data set (i.e., data that doesn’t follow the general pattern). This data may be interesting (e.g., if it signals a spike in the sales of certain products) or may need further investigation (e.g., if it indicates potential instances of fraud).


